Return to Map Specimen Database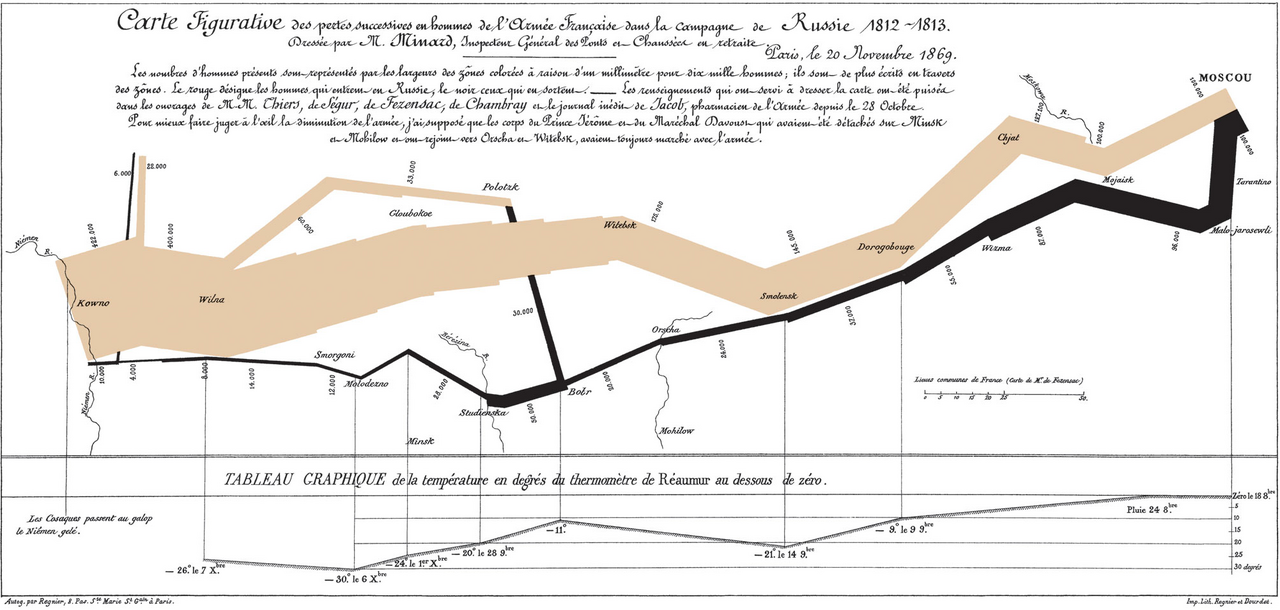
Era: Thematic & Scientific Revolution·Cartographer: Charles Joseph Minard·Year: 1869·Public Domain
Minard’s Map of Napoleon’s Russian Campaign (1869)
"'The best statistical graphic ever drawn': Visualizing the catastrophic loss of 422,000 soldiers"
Minard visualized Napoleon's 1812 invasion of Russia by combining six variables in a single flow diagram: army size, geographical location, direction of movement, river crossings, date, and sub-zero winter temperatures during the retreat.
Interactive Specimen Pan & ZoomAccession: BnF Cartes et Plans, GE D-1249
Orientation: West-to-East (Advance) / East-to-West (Retreat)
620 × 400 mm
Charles Joseph Minard·1869·Bibliothèque nationale de France (BnF) / Library of Congress
ZOOM: 100%Repository Archive
Notable Cartographic Signatures
- Width of the brown band represents troop strength marching toward Moscow
- Black band shows the retreat, tied directly to a freezing temperature chart below
- Catastrophic thinning of the band at the Berezina River crossing
The Rhetorical & Ideological Argument
"An anti-war masterpiece demonstrating that military hubris and brutal winter geography destroyed the Grande Armée—shrinking from 422,000 men entering Russia to just 10,000 survivors returning."
Explicit Features
- Width of the brown band represents troop strength marching toward Moscow
- Black band shows the retreat, tied directly to a freezing temperature chart below
- Catastrophic thinning of the band at the Berezina River crossing
Intentional Omissions
- Battle tactics, commander heroics, and glorious imperial portraits
Physical Specimen & Geodesy
Projection:
Thematic Flow Coordinate Chart
Orientation Axis:
West-to-East (Advance) / East-to-West (Retreat)
Physical Medium:
Lithographic thematic flow diagram on paper
Original Physical Dimensions:
620 × 400 mm
Custodial Repository:
Bibliothèque nationale de France (BnF) / Library of Congress
Accession: BnF Cartes et Plans, GE D-1249
Interdisciplinary Context & Connections
NarratologiumPIONEERS
Tragic Statistical Data Storytelling
ChromologiumEXEMPLIFIES
Bivariate Flow Contrast Shading
Academic Provenance: Minard, C. J. (1869)